A Journey of Maintaining Device Farms for E2E Testing
Continuing from the end-to-end testing series, today we’ll dive into the practical challenges of maintaining a device farm - something that’s much easier said than done.
A device farm refers to the infrastructure - usually a server setup - responsible for managing and orchestrating E2E test executions across physical devices. This could be a mix of iOS and Android phones connected to a server.
Maintaining such a device farm can be challenging, and require deep technical insight to mitigate stability and performance issues. This post is story-telling the journey I went through maintaining device farms in my previous company.
When I joined the company, the farms were barely stable. There were two farms, one in Hong Kong, and another in Singapore. The Hong Kong farm was the primary one, housing the majority of the devices. These devices (both iOS and Android) were physically connected to a Linux machine.
Despite the machine’s high-end specs, the observed performance and reliability were not that great due to various reasons. Let’s explore why, especially on the iOS side..
Long-Running Services
Our E2E tests were powered by Appium. We ran an Appium server directly on the Linux machine, to interact with the connected devices.
Initially, we used a single shared Appium server for all devices - iOS and Android. This turned out to be a poor architectural decision.
The first challenge was to ensure the uptime. Since tests could be triggered at any time, the Appium server needed to run 24/7. Over a period of one or two weeks, we noticed that the Appium process memory went up from under 2GB to more than 10GB, maxing out the system memory. This resulted in a very slow Appium response times due to the nature of the swap memory being used. A request might take up to a few seconds to finish (the typical duration should be way under one second). Test executions became painfully slow as a consequence.
We had to restart the Appium server to recover performance, But doing so caused all active sessions to fail. Even though we followed best practices to release resources from the client side (eg. by quitting the driver session after done), the issue persisted. We came to a conclusion that there could be memory leaks from Appium, leading to the accumulated memory over time.
Service Restart and Backup Services
To mitigate this, we developed a mechanism to periodically restart services - but without affecting ongoing sessions.
Our solution involved a backup Appium server. Let say, the primary server runs on port 8096, then the backup server listens on port 8196. We scheduled a daily service restart at a predefined time, 11PM - for instance. The time window from 10PM to 12AM is called the maintenance zone. During this time, all incoming requests were routed to the backup server. This gave us a safe window to restart the primary Appium server.
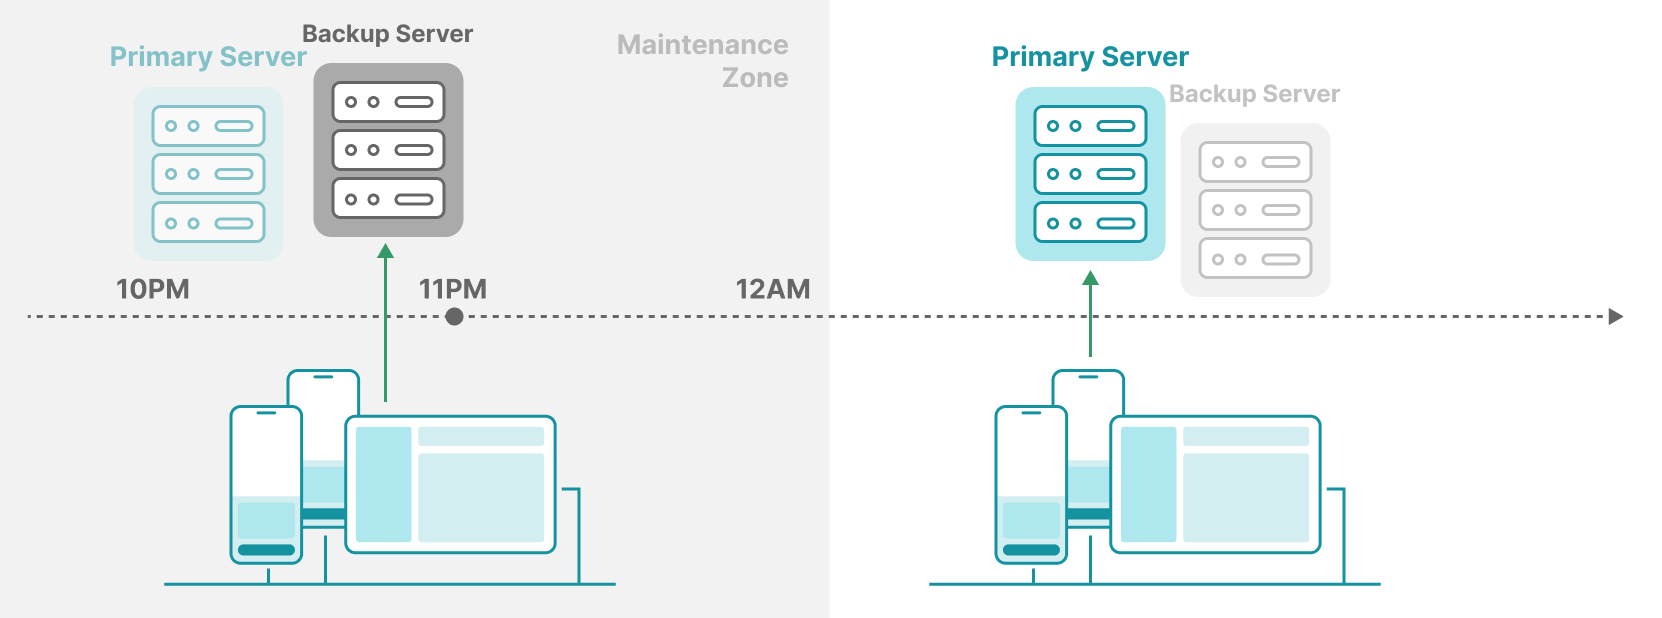
Once the window ended, the primary server resumed traffic, and we shut down or restarted the backup server. The alternate restarts between the primary and the backup kept the long-running executions stable. This strategy is inspired by the blue-green deployments in web services.
Monitoring Health
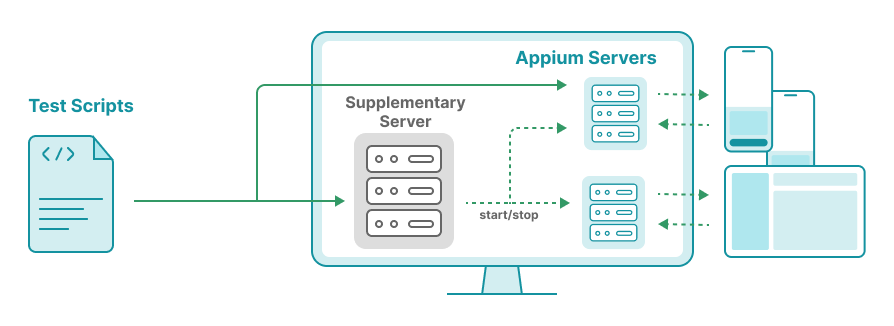
Realizing the severity of the performance issues, we implemented a monitoring system to surface server health issues so that we could respond in time. That’s where our supplementary server came in - a lightweight Flask app running on the host machine.
This server periodically ran scheduled jobs to monitor critical metrics. If, for instance, Appium memory usage crossed 75% of system memory, it triggered alerts.
Dedicated Appium Server per Session/Device
Even with service restarts in place, there was still one major problem: log noise.
Our main focus that time was addressing stability issues which required diving into Appium logs for insights. However, using a shared Appium server made it extremely difficult to debug individual test sessions as logs from multiple devices were intertwined.
So we moved to a separate Appium server per device model. Each device was assigned a fixed port (for its Appium server). For example, if device ID 1234 ran tests, we spun up an Appium server on port 11234 at the start of the session, and shut it down at the end. This way, logs were clean and isolated, resources were properly disposed, giving way to other executions. The supplementary mentioned above took care of starting and stopping these sessions. After adopting this model, we no longer needed the service restart logic for Appium.
Linux vs. Mac Server for iOS Devices
Originally, our iOS devices were connected to the Linux server. Since Linux doesn’t natively support iOS device connections, we used a third-party tool called libusbmuxd. Big thanks to the open-source community for making this possible. However, the cracks began to show over time.
A typical one was the resource temporarily unavailable problem where connections to devices were refused. This was often accompanied by unusually high CPU usage from the usbmuxd process, sometimes exceeding 100%. We had no choice but to restart the usbmuxd service. Although it can be detected and auto-resolved by the supplementary server, the issue was unpredictable and critical.
Additionally, using Linux limited our ability to utilize developer tools like xcodebuild, simctl, or devicectl. For example, launching the WebDriverAgent (WDA) for testing on iOS 17+ devices is straightforward on macOS, but far more involved on Linux.
Because of these limitations, we migrated iOS devices in Hong Kong to a dedicated macOS machine. Typically, a Mac mini could host up to 8 devices without significant overhead.
However, macOS needs tuning and careful attention to ensure best performance. There shall be services or processes that you don’t really need. For example, Spotlight indexing - if enabled - may hurt performance because test executions often come with I/O tasks. You might see the fseventsd process consuming excessive CPU. In this case, just kill that process (don’t worry, it’s auto restarted, and be back to normal, ie consuming low CPU). Then, disable indexing.
Detecting and Cleaning up Stale Processes
Another aspect of farm health is dealing with stale processes. A stale process here refers to a process that’s no longer in use.
We used Sonic, which interacts with devices using SIB (sonic-ios-bridge). When a test starts, Sonic spawns a process to launch WDA. Upon completion, it kills the process. But what if a test session crashes or is force-aborted without proper cleanup? The process might remain stale. This, of course, depends on the implementation details of the tools involved… Over time, those stale processes hog system resources. We once found multiple SIB processes tied to the same device ID - which did not make sense. This was also the reason why we assigned a fixed Appium port or WDA port for a device. This way, we can identify zombie processes and remove them. In fact, we once claimed back 3GB of memory usage by cleaning up stale processes.
Another adverse effect of stale processes was the number of occupied ports growing. A typical test process - such as a SIB process - occupies two ports on the host machine: WDA port (to communicate with the automation backend), and MJPEG port (for streaming the recording). With stale processes, these ports remained occupied, gradually reducing the pool of available ports. We used to face the issue where there was no usable ports for Android because the UIAutomator2 driver uses a fix port range (8200 - 8299) (see: here) which became saturated in case of stale processes.
Therefore, we scheduled hourly cleanup jobs (via the supplementary server) to ensure the server machine is in a healthy state.
Ensuring Critical Services
Given the high volume of usage, several critical services - such as Sonic, Appium, usbmuxd, and a few internal supplementary components - at times crashed or became unresponsive. When that happened, the impact was significant. After a few incidents, we realized the importance of detecting potential issues upfront.
To address this, we implemented a service recovery mechanism that continuously monitored a predefined list of critical services. If any of these services crashed, the system would automatically restart them. This recovery check was scheduled to run every 30 seconds to minimize the downtime.
Supplementary Server as the Coordinator
Originally built for simple health monitoring, the supplementary server evolved into a core component of our device farm management.
It now orchestrates task scheduling, health checks, and also offers backdoor APIs for diagnostics. For instance, if a test session fails due to a device issue, we can trigger the server to reboot the device, gather logs, or retry the test automatically. Such a diagnosis action can be: taking screenshots, reporting battery info, listing running processes, or force-killing a certain process.
You might ask “Why taking screenshots when Appium already supports it?”. Well, Appium APIs require a successfully created driver. But there might be reasons causing failures during driver creation. In such cases, screenshots captured by the supplementary could help reveal what went wrong.
As the supplementary server took more responsibilities, it too became a critical service 😅. So, we added a cross-monitoring between servers: the Hong Kong server would monitor the health of the Singapore server, and vice versa.
Handling “Trust This Computer” Popups
Permission popups, especially the infamous “Trust This Computer” popup, were among the most frustrating hurdles we faced. Without prior authorization, the system blocks access to essential services including UI automation, causing test failures.
This popup typically appears when an iOS device is connected to a new computer. You tap “Trust” once, and the device is expected to remember the decision. At least, that’s how it should work. But in practice, it didn’t.
We frequently ran into scenarios where a previously trusted device suddenly lost its authorization. For example, the cable being unstable at times might also trigger the re-authorization. We didn’t figure out the pattern yet. Only when tests failed did we realize the issue.
Even worse, sometimes the trust dialog didn’t reappear after reconnecting the device. In those cases, we needed to run a special command to trigger the pairing popup.
$ pymobiledevice3 lockdown pair --udid <UDID>
The issue became more frustrating due to our farm’s geography. Most of our devices were physically located in a different office. So when the issue occurred, we had to rely on our onsite colleagues to operate on the encountered devices. While their support was always appreciated, the process was often slowed down by communication gaps and knowledge gap.
Final Thoughts
Maintaining a device farm isn’t just about plugging in phones and pressing play. It requires careful system design, detailed monitoring, and the ability to recover from failures.
Throughout this journey, we encountered a wide range of issues from unreliable device connections to leaks and stale processes, leading to performance degradation. We gradually adopted a series of strategies that helped us build a more stable and resilient infrastructure. Yet, not all problems were purely technical. Some - like the unpredictable “Trust This Computer” popup - still required manual intervention.
Like what you’re reading? Buy me a coffee and keep me going!
Subscribe to this substack
to stay updated with the latest content